Know your practice
inside out.
Revenue, caseloads, sessions, retention — per clinician, per month. The practice dashboard that replaces spreadsheets.
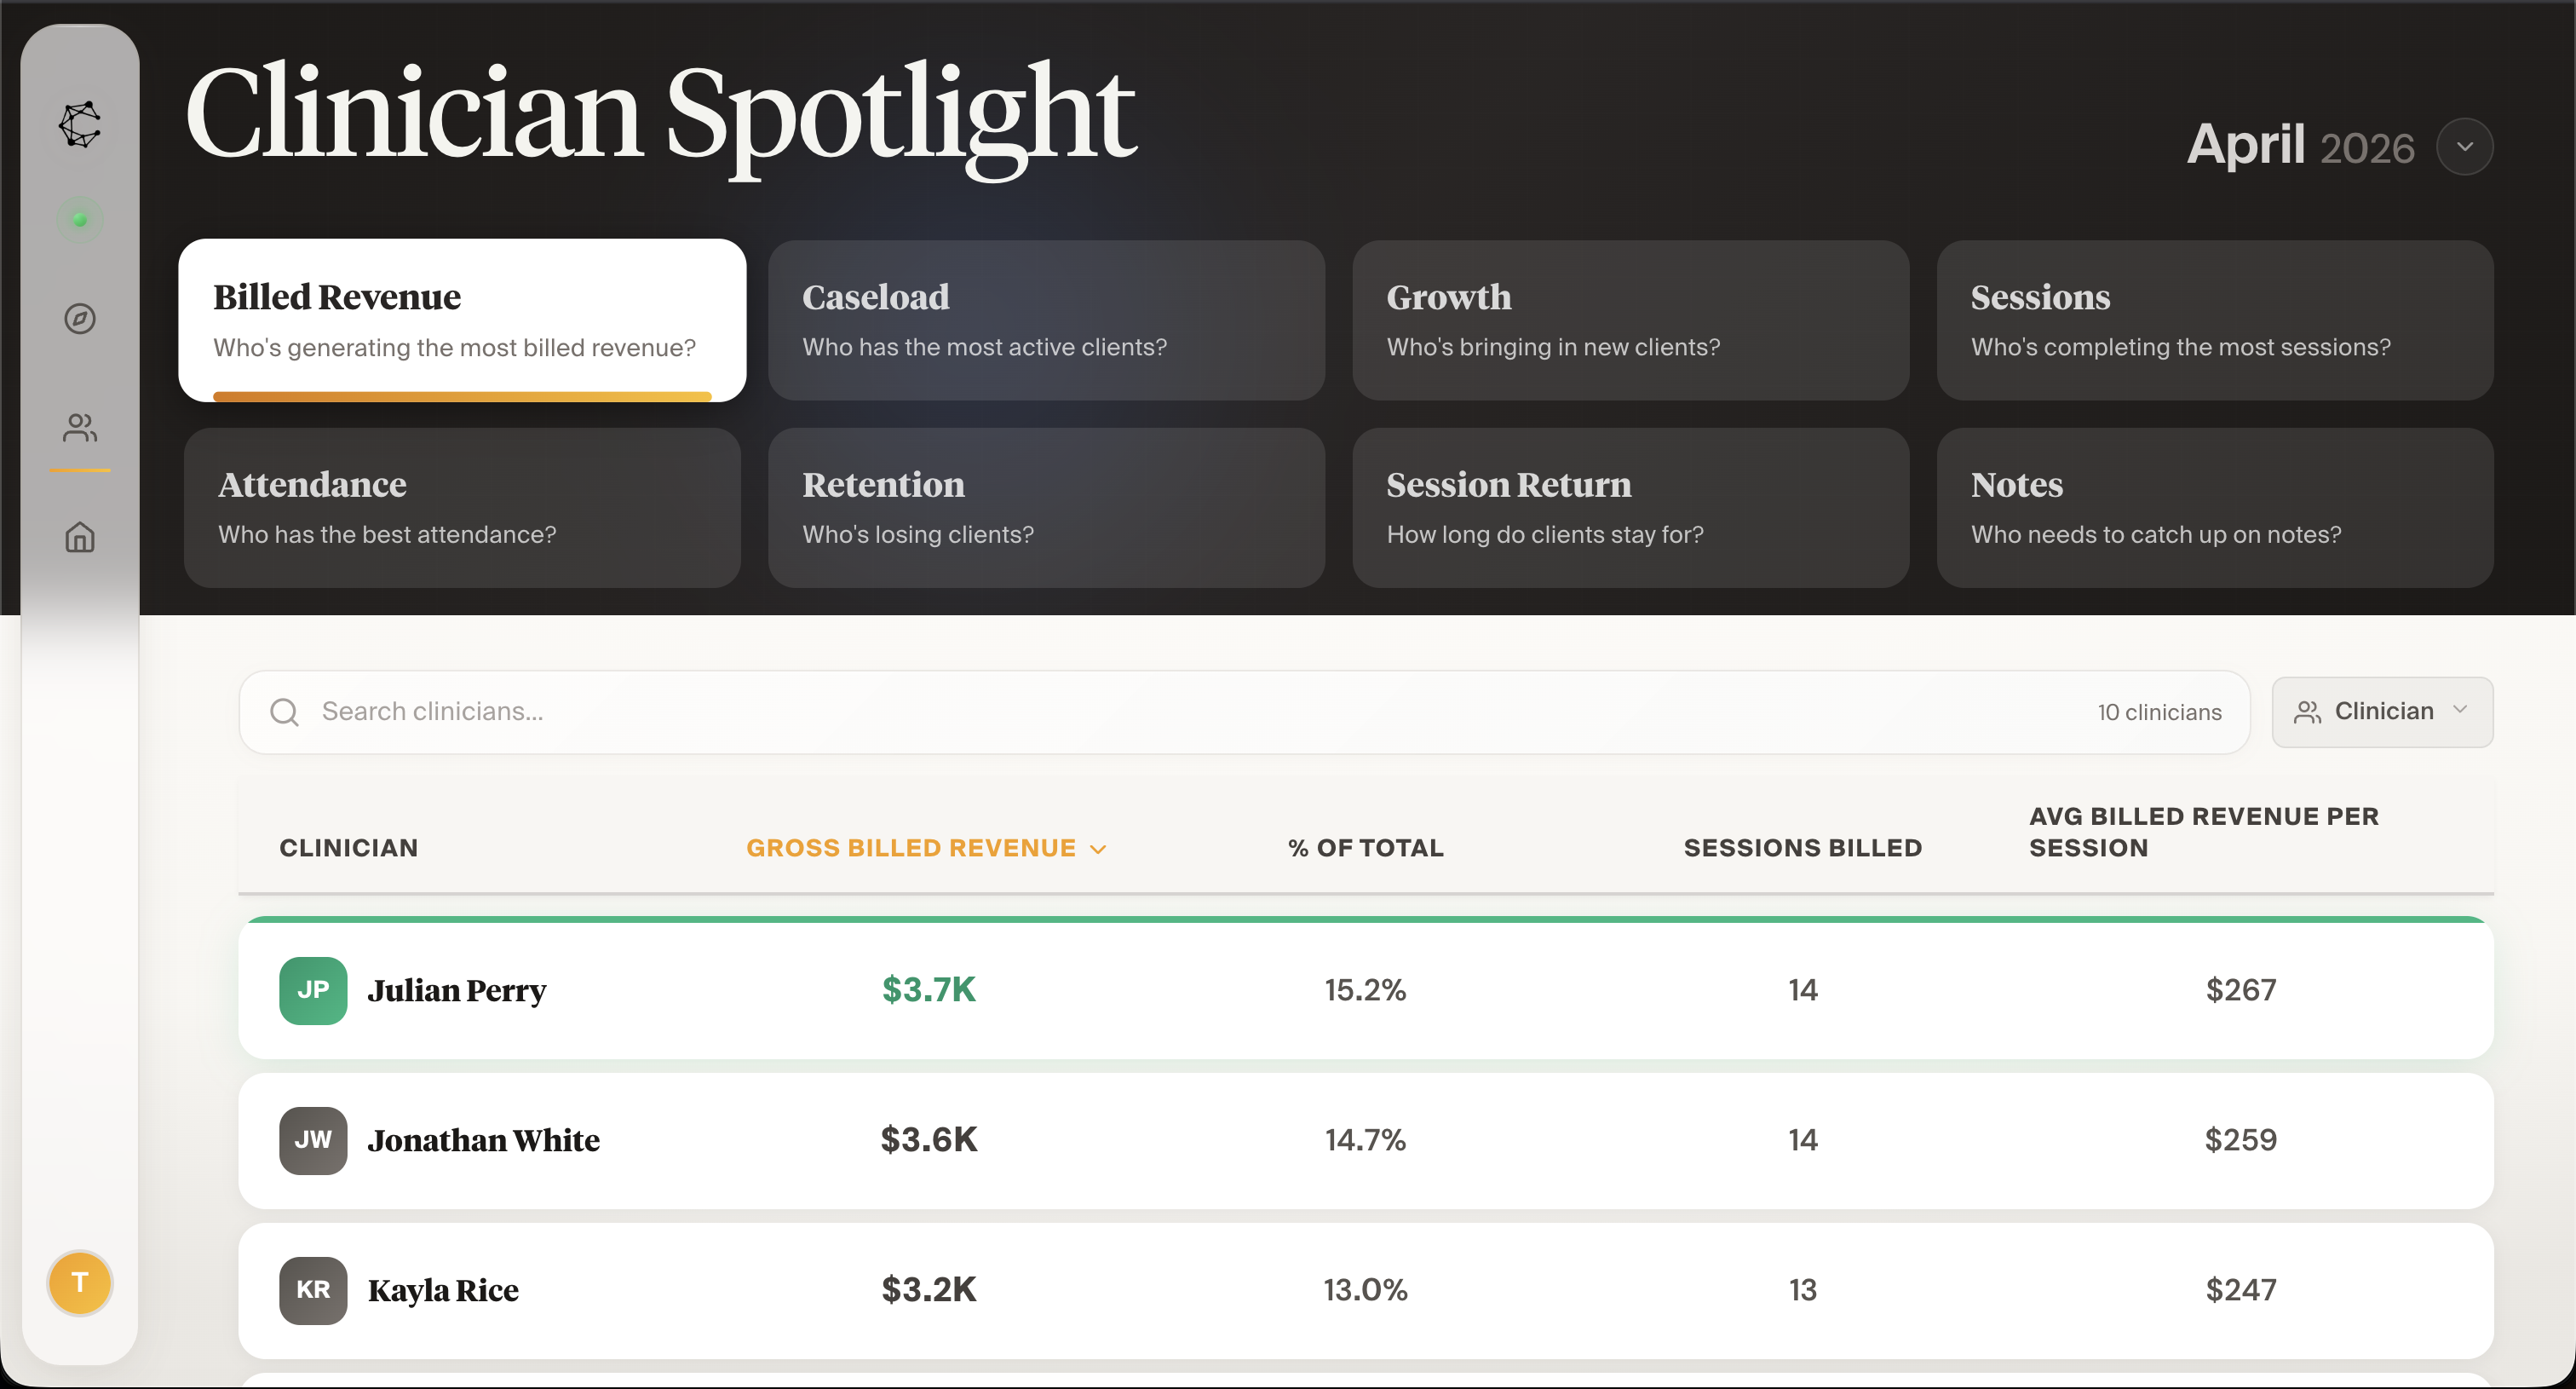
Drill into any clinician
Click any name in Clinician Spotlight and see their full picture — revenue, sessions, caseload, and retention over time.
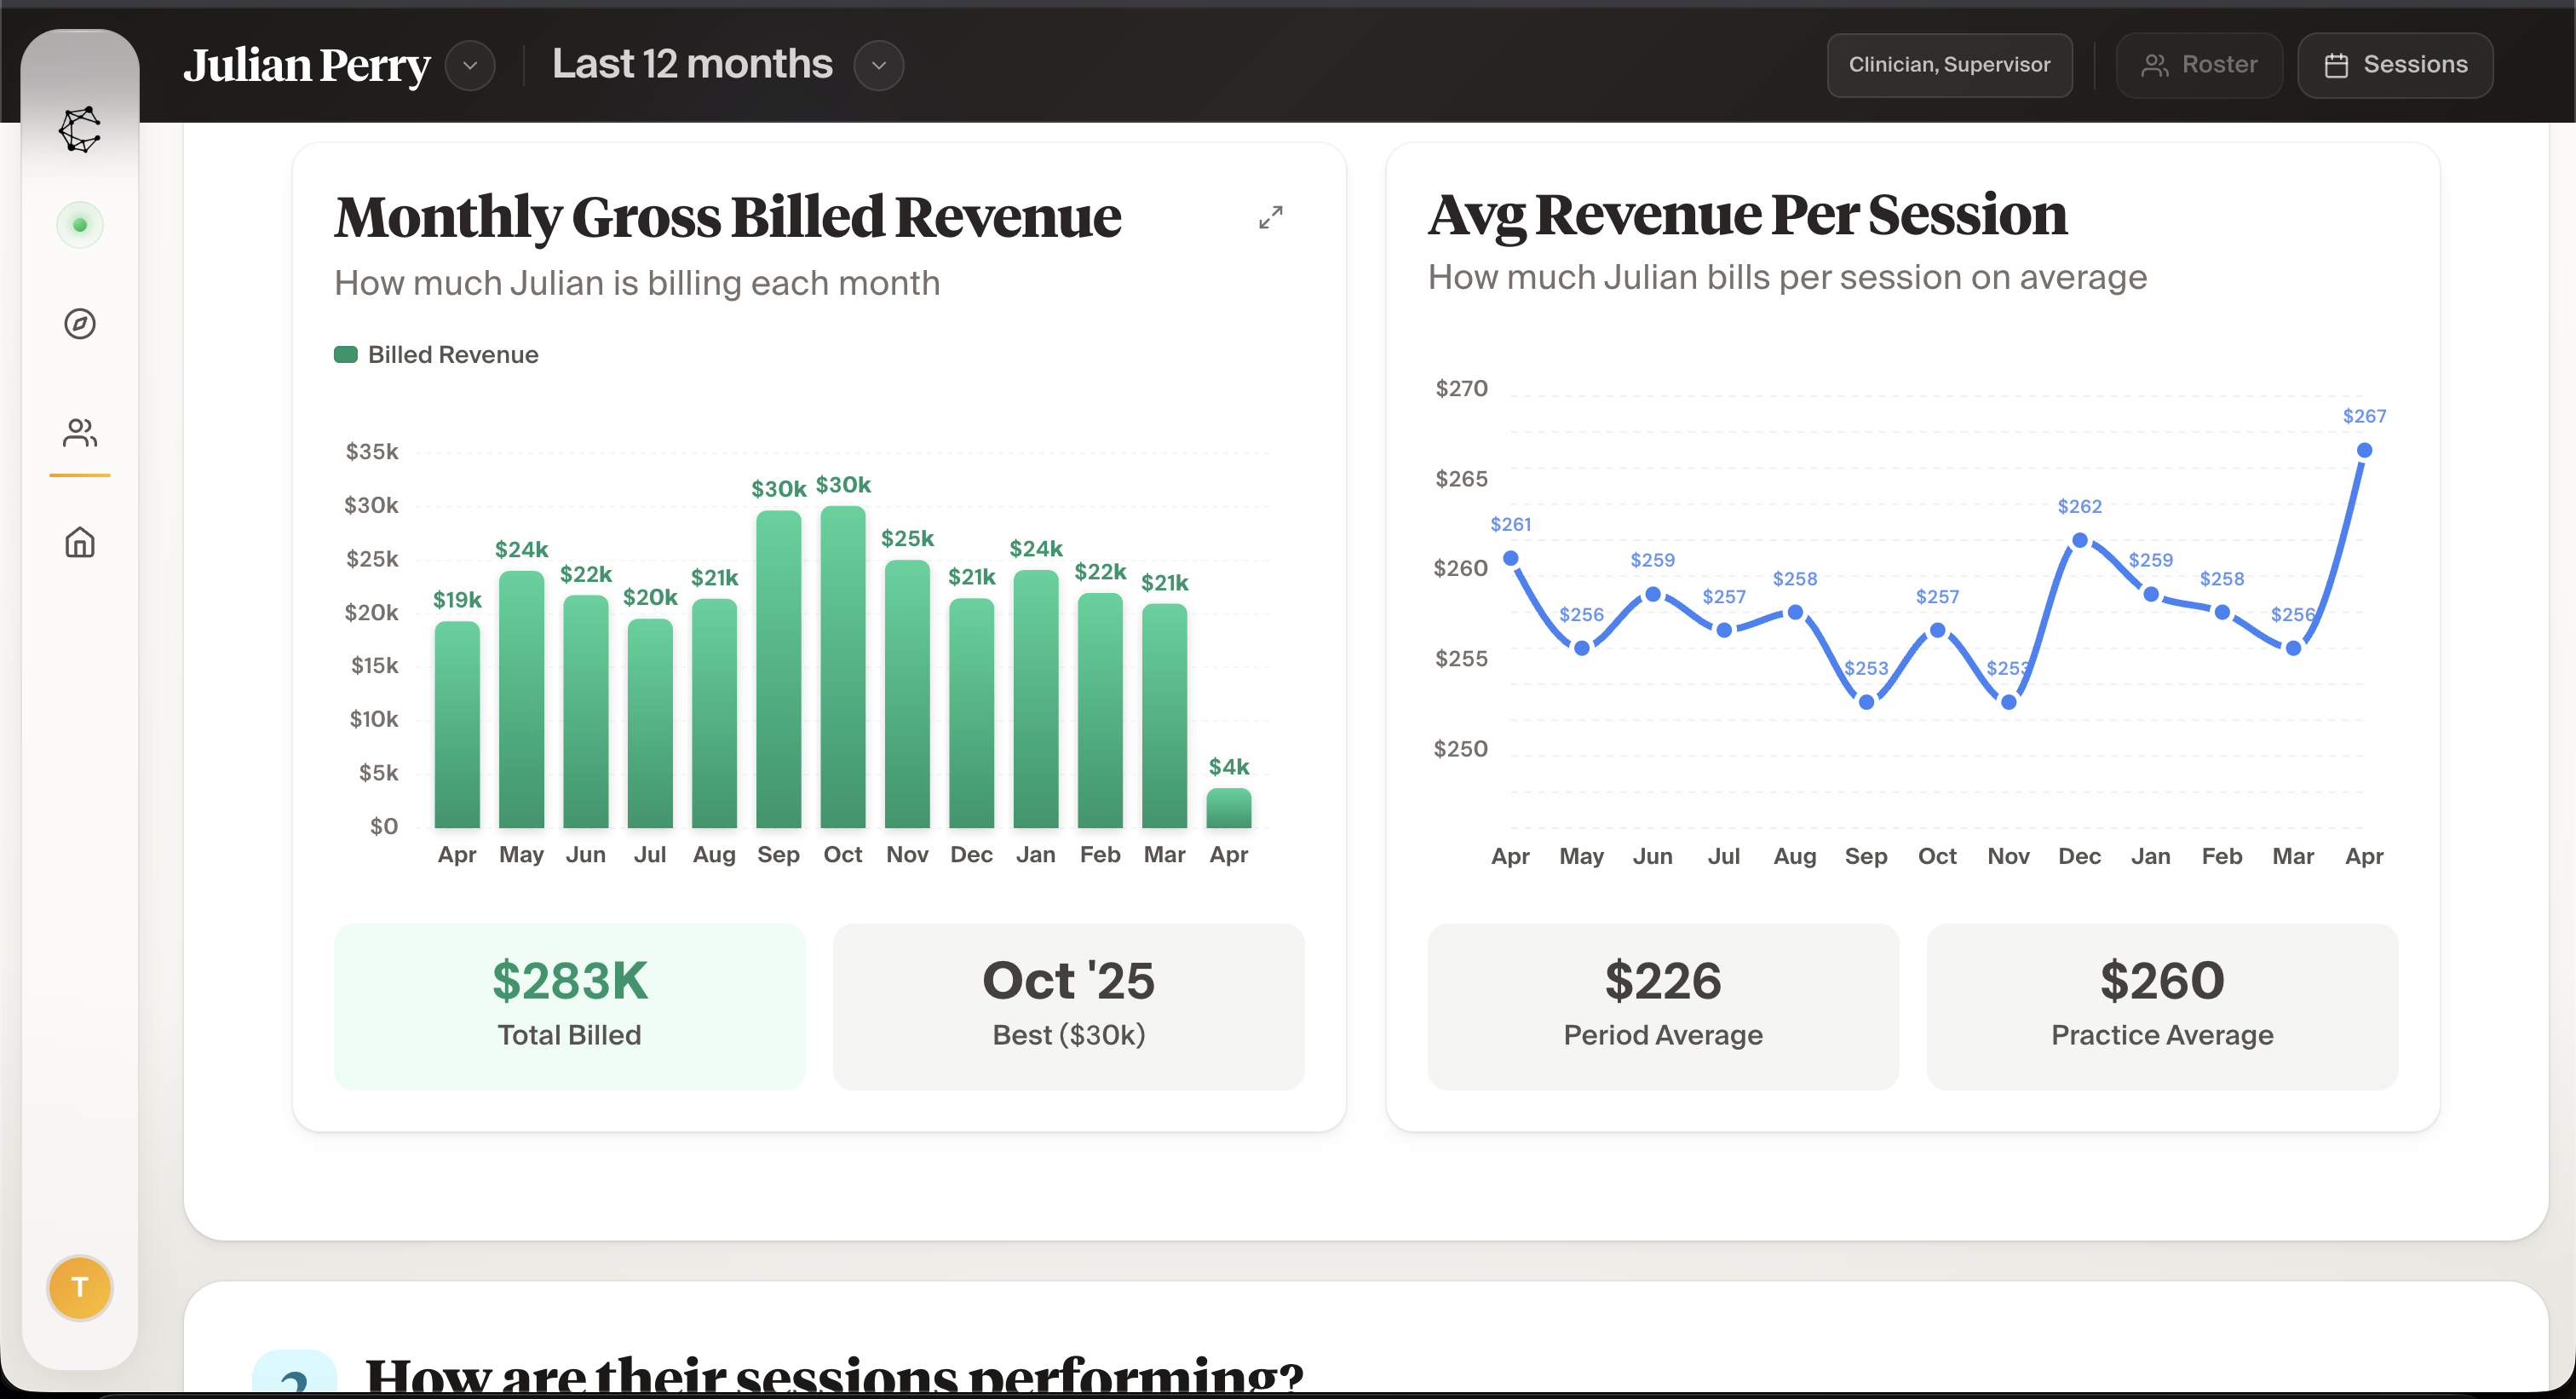
Revenue Trends
Monthly gross billed revenue, per-session averages, and period-over-period comparisons for every clinician.
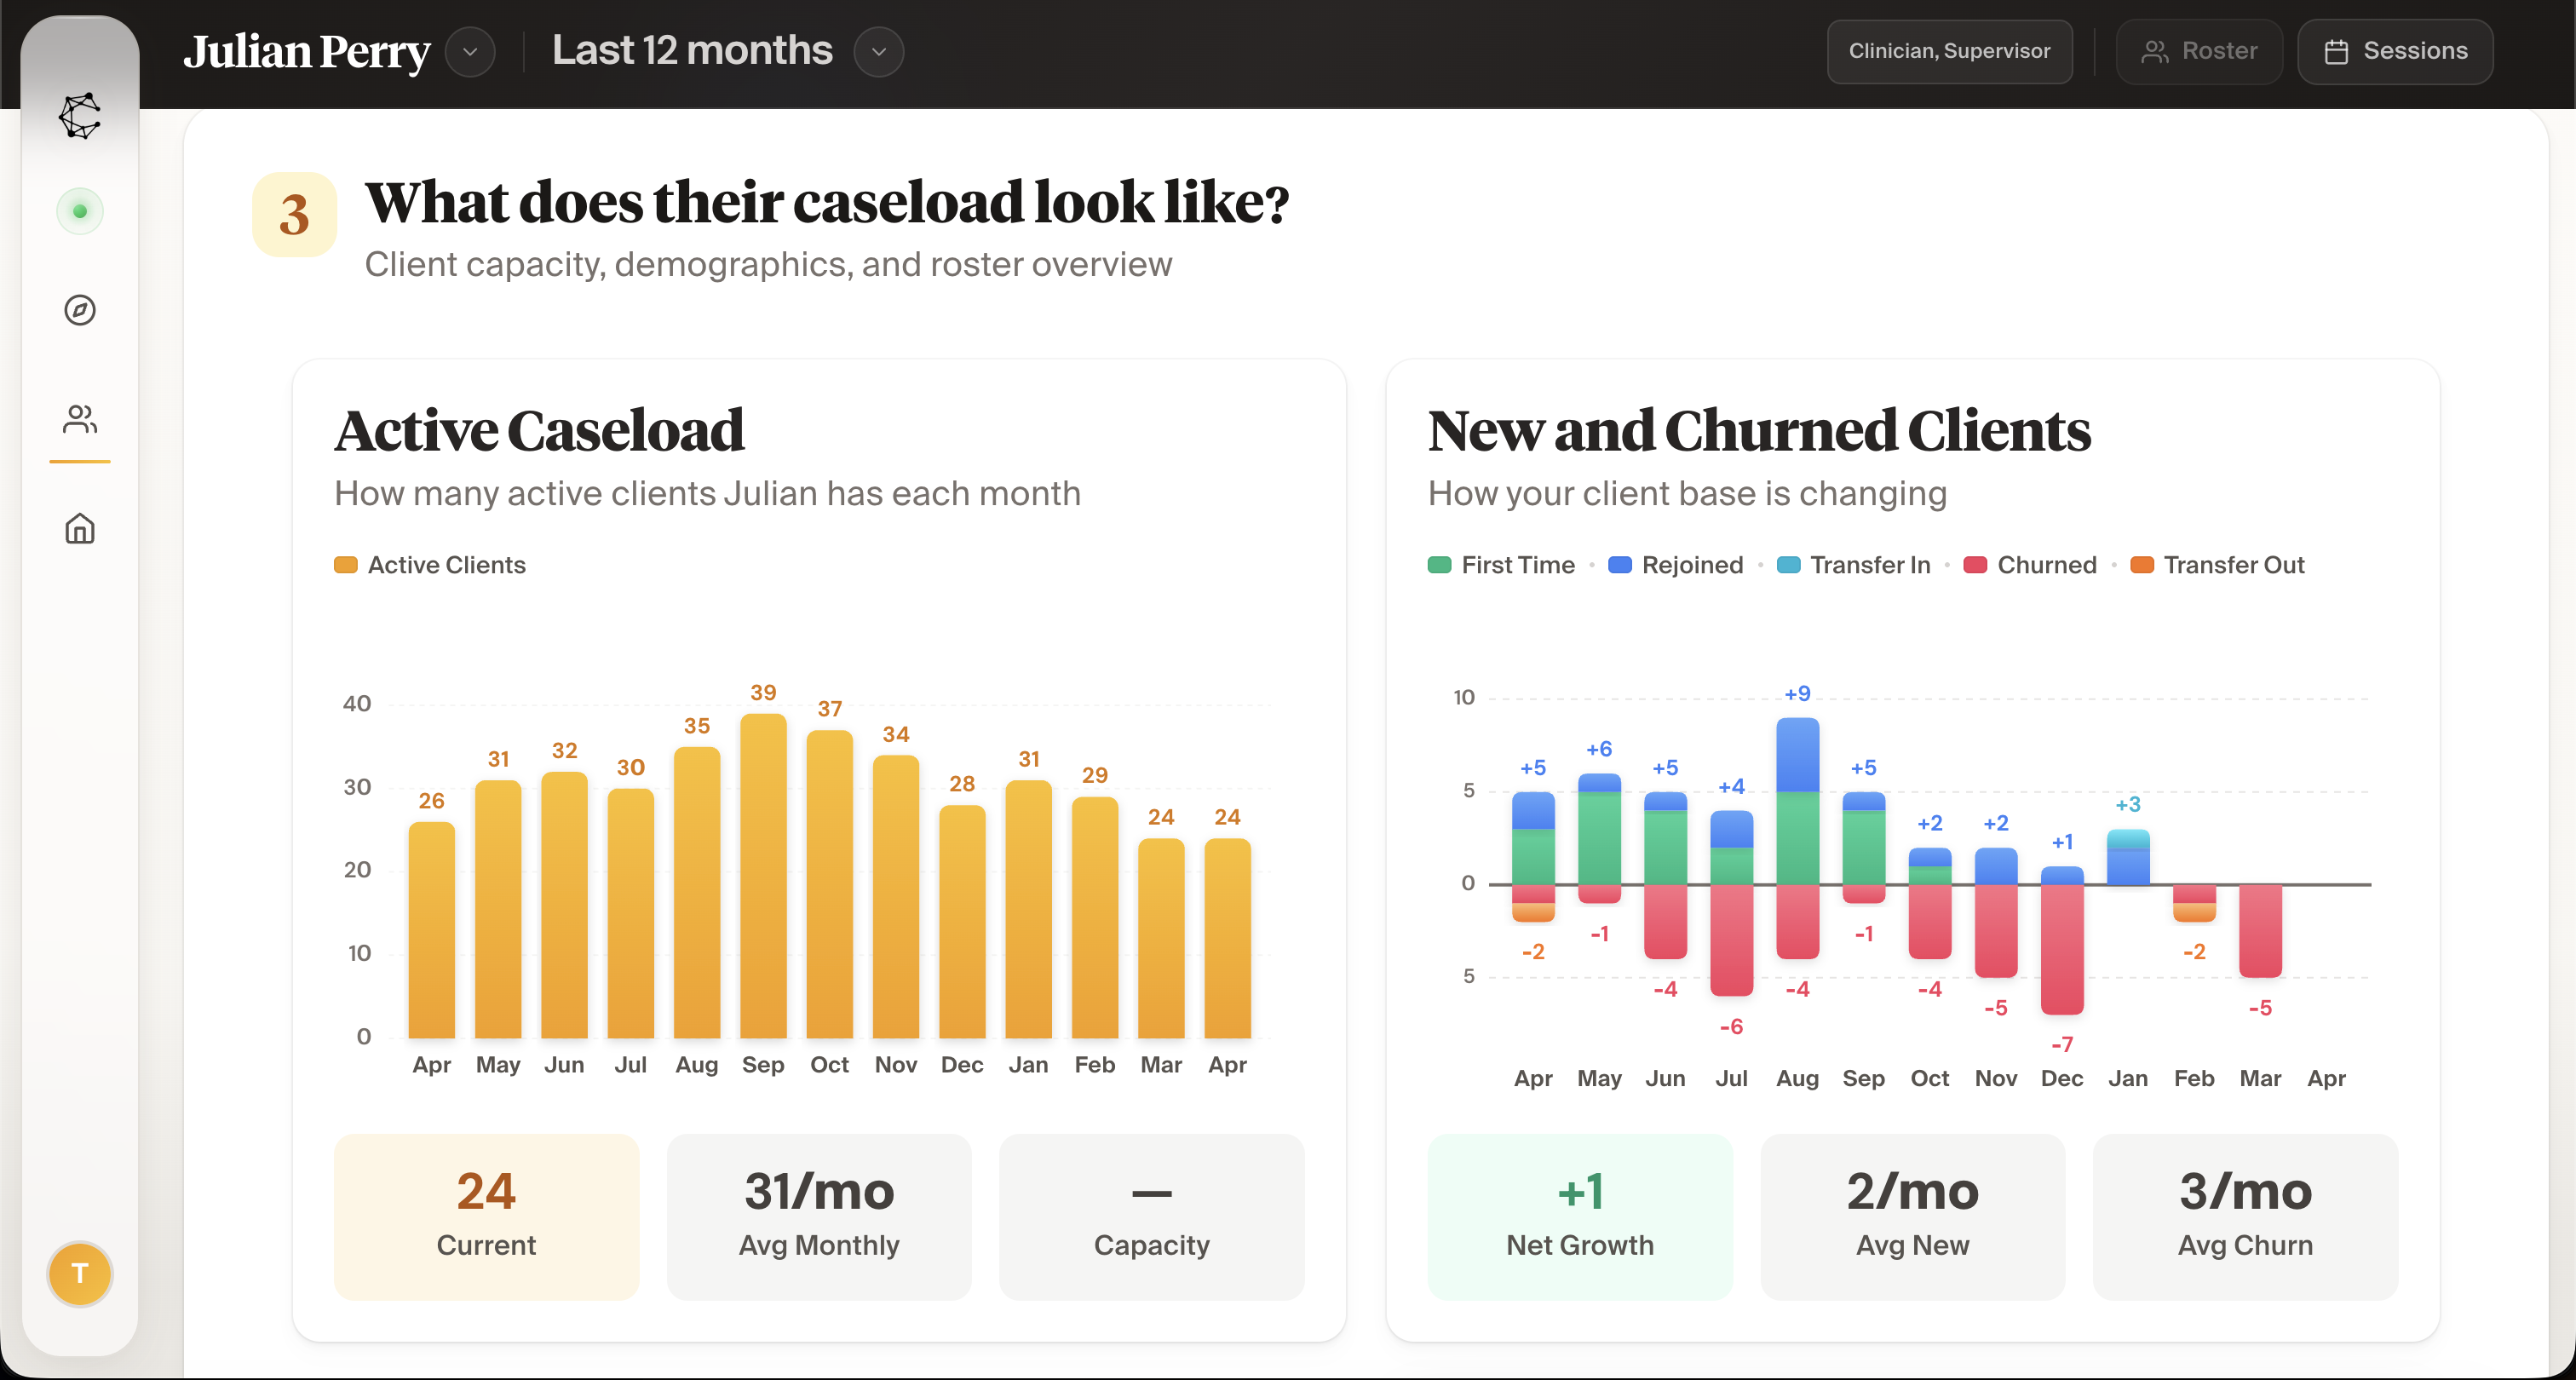
Caseload & Retention
Active client counts, new intakes vs. churn, and net growth — so you see exactly where your practice is heading.
Revenue Trends
Monthly gross billed revenue, per-session averages, and period-over-period comparisons for every clinician.
Caseload & Retention
Active client counts, new intakes vs. churn, and net growth — so you see exactly where your practice is heading.
Revenue Trends
Monthly gross billed revenue, per-session averages, and period-over-period comparisons for every clinician.
Caseload & Retention
Active client counts, new intakes vs. churn, and net growth — so you see exactly where your practice is heading.
Insights that surface
Real data from real practices. Here's the kind of clarity your dashboard delivers every month.
Julian earned $3.7K this month — 15.2% of total practice revenue
Jonathan's caseload peaked at 39 active clients in October — now down to 24
Kayla averages $247 per session — $13 below the practice average of $260
3 clinicians average 2+ churned clients per month — a retention flag
October was your best revenue month at $30K gross billed — driven by 2 clinicians
Net growth of +1 client per month — new intakes are just outpacing churn
From connection to clarity
One integration. No spreadsheets. Your dashboard builds itself.
Connect your EHROne-click OAuth connection. We never store credentials — just read-only access to the data you choose. | 5 min |
We sync your dataRevenue, sessions, caseloads, and notes are imported and structured automatically. | 20 minutes |
Your dashboard is liveClinician Spotlight, revenue trends, caseload tracking, and retention metrics — all in one place. | Day 1 |
Insights keep buildingThe longer you use Cortexa, the richer the trends. Monthly snapshots make every review session easier. | Ongoing |
Ready to see your data?
Book a 20-minute demo. We'll connect your EHR and show you what your dashboard looks like — with your actual numbers.