
Use your EHR for the details
An EHR report may be the quickest way to check an appointment, bill or payment. TherapyNotes’ billing page shows bills, payments and actions to take. SimplePractice’s dashboard links summaries to detailed reports. Both are worth exploring before adding a tool.
Your biller needs to open the claim. Your scheduler needs the appointment. Your clinician needs the note. Those records belong in the system where your team does the work. A practice dashboard helps you see what to pay attention to.
Begin by asking whether the report already exists and whether the right person can access it. An access, training or settings problem should not automatically become another software purchase.
Use analytics to understand what changed
A group owner often starts with a different question: why are sessions down if the calendar looks full? The answer may require looking at completed appointments, cancellations, changes in availability, new-client activity and returning clients. Each total can be accurate while the overall explanation remains hard to see.
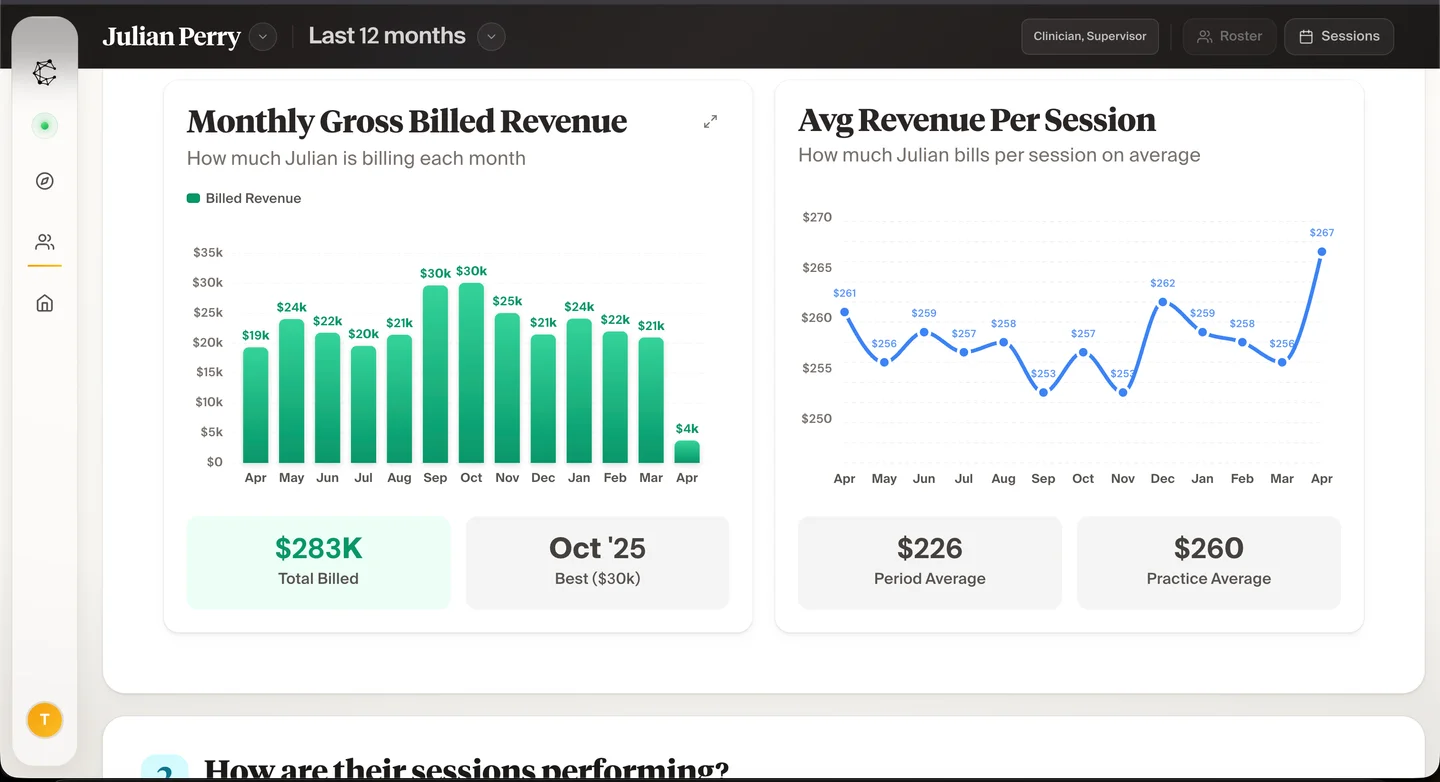
Cortexa lets you start with the practice as a whole, then look at individual clinicians. You can see changes in client numbers beside session activity, and amounts billed beside the work provided.
The benefit is making the question easier to answer and discuss with your team. Try the Cortexa analytics experience with a question that currently takes several reports to work through.
Where should you look first?
Find a bill, payment or note
Start in the EHR or billing platform. That is where the original record and required action belong.
Understand a practice-wide change
Use analytics to compare sessions, available appointments and caseloads. Check original records when needed.
Prepare a clinician conversation
Review clinician trends, then discuss context. Business figures alone do not measure care quality.
Follow an inquiry
Use intake and consultation records. Session reports start too late to show the whole journey.
Explore a what-if question
Use a calculator or spreadsheet to change assumptions and compare outcomes.
Get the work done
Assign someone to act. A dashboard identifies the work; it does not complete it.
An example: a busy calendar, fewer completed sessions
Imagine a practice whose calendar shows 100 scheduled sessions in a week, of which 80 are completed. The following week still has 100 scheduled, but only 70 are completed. Looking only at scheduled volume suggests stability. Looking at completed sessions identifies the change, but not its cause.
Next, separate cancellations, no-shows and other statuses using consistent definitions. Review where the change occurred, which clinicians were available and whether the period contains leave or rescheduling. Examine whether fewer returning clients or a different new-client mix contributed. Use the relevant original records to validate the explanation.
The management decision follows that investigation. You might review reminder timing, check a scheduling mismatch or simply recognize an unusual week. You should not turn the first chart into a claim that a clinician performed poorly. The numbers in this example are illustrative; the point is the sequence of questions.
What Cortexa adds to your weekly review
Cortexa brings together sessions, open appointment time, active and returning clients, clinician performance and revenue. Its caseload screen shows how the client total changes. Clinician Spotlight lets you review the team by the question you are asking, such as attendance or sessions, rather than giving each person one overall score.
You can ask questions about practice data and follow inquiries and consultations toward care. This helps you explore what happens before the first appointment, as well as the sessions already completed.
In a demo, try a question from start to finish. Check which records are included, what each number means and which details you can open. You should leave knowing whether the view would make your weekly review easier.
Check the totals before relying on them
Two reports can disagree because they count different things. One might include every scheduled appointment and the other only completed sessions. One might show money billed and the other money received. Check those meanings before treating a difference as an error.
- Compare the same dates, using the same date type, such as appointment date or payment date.
- Include the same clinicians, services and appointment statuses.
- Check what the money figure represents: the amount billed, the amount insurance allows, or money actually received.
- Look for late entries, corrections and transfers that explain a difference.
- Write down the reason for the difference so the next person can understand it.
When the reports you have are enough
If your EHR lets the right person answer the question reliably, keep using it. A small practice with a simple reporting routine may get sufficient value from the tools already included. A dedicated analytics subscription should solve a demonstrated management need.
Other EHRs also invest in analytics. For example, Jane’s reporting and analytics offer makes reporting a visible part of its product. Compare the specific system and workflow rather than a stereotype of the entire category.
If useful reports still leave you spending evenings on inquiries and billing, you may need a team to help. Full Service Partner combines analytics with agreed administrative work. It is a separate option from the Analytics subscription.
Common questions
Do EHRs have analytics dashboards?
Yes. Several EHRs publish analytics and practice-reporting capabilities. Evaluate your actual system’s views, access and definitions before deciding you need an additional tool.
What does Cortexa add if the data already exists in the EHR?
Cortexa brings practice and clinician views together so you can explore sessions, open time, caseload changes and revenue. You can also ask questions about the data and follow inquiries toward care. Try a question that is hard to answer in your current reports.
Which number is correct if two reports disagree?
First check what each report counts. Compare the dates, appointment statuses, clinicians and whether the money figure means billed or received. Two different totals may both be correct if they answer different questions.
Can analytics take over clinical documentation or claim submission?
Analytics helps you understand the practice. Clinical notes stay in your record system, and claims stay in the system that submits them. If you want Cortexa to help with billing and other tasks, that is part of a separate Full Service Partner agreement.